
In times of advancing digitalization, data is playing an increasingly important role in the value creation process of products and services or simply in the economy as a whole (keyword Industry 4.0). A successful digital transformation of organizational structures, processes and business models is therefore essential in order to become and remain successful. You have probably also already heard that data is the new oil or other comparisons that emphasize the outstanding position of data in the age of digitalization. In what way it makes sense to compare data with oil, where the similarities and differences lie, and what all this has to do with meaningful reports is explained in the following.
In an influential article from the Economist in 2017, “The world’s most valuable resource is no longer oil, but data,” a rather negative comparison is made between the resource oil and the “new” resource data, in that the author points to the monopoly position of the so-called Big Tech Five Google (Alphabet), Amazon, Facebook, Apple, and Microsoft (GAFAM). For the most part, however, the equation of oil and data as a resource rather refers to the value of data or the potential of Big Data by means of artificial intelligence (AI), machine learning (ML) and data science.
Excursus: The "history of data"
Of course, data has been accumulating since the third industrial revolution in the early 1970s and the electronics it introduced for the central control of production processes. However, while for a long time data only appeared as a result of processes in companies and was used in a supporting role, today it is both a valuable resource and a final product. With the use of ERP systems, for example, data has become a necessary basis for corporate value creation. In today’s society, the use of information and communication technologies (ICT) is taken for granted. Due to the constantly growing amount of data from various areas of life, products and services can be digitally enhanced and linked with each other. Physical products are currently taking a back seat to complementary services, software, and data. This development also marks a turnaround from the classic product and service focus to a focus on tailored solutions for individual consumers and their needs. Data has thus evolved over time from being the result of a process to being an enabler of processes and products to becoming products themselves.
You can find out even more about this in the 2017 (German) white paper “Importance of data in the age of digitalization” from the Fraunhofer Institute for Material Flow and Logistics (IML).
Another interesting aspect of the comparison between data and oil is that it can also be applied to the process of data acquisition and use. Similar to oil, data must first be located (in the company), tapped and extracted, then refined and (further) processed. The term Data Pipeline is used to describe the transmission, consolidation and structuring of data.
However, data as the “resource of the future” has a very serious difference compared to oil – it is not consumed. According to the German AI researcher Volker Markl in an interview with the Tagesspiegel from 2020, data should therefore be compared to a production factor such as capital, labor or soil instead of a raw material: “data is not the new oil, but the new soil”.
New information can be obtained from the breeding ground of data. And just as soil needs to be fertilized or watered, data needs to be maintained, cleaned, and updated.
Excursus: Data Supply Chain
In the (German) white paper “Importance of data in the age of digitalization” published by the Fraunhofer Institute for Material Flow and Logistics (IML) in 2017, the following seven cornerstones of a so-called data supply chain (based on a classic supply chain) are set out:
- Description of data goods
Standardized description of metadata and development of a taxonomy
- Exploration of data assets
Keyword Big Data: Making data discoverable
- Inventory of data assets
Connecting individual data silos and making them available for use & maintenance and management of data assets
- Evaluation of data assets
Defining indicators and methods for measurability & evaluation of economic values, technical connectivity and quality of data
- Provision of data assets
Integration into user value chains & simplify connection of data assets and provide a framework
- Configuration of value chains for data goods
Define digital services from a business perspective and deliver them in an automated way via efficient infrastructure connectivity
- Synthesis of data goods
Needs-based preparation of data and processes for each use case
It quickly becomes clear that no powerful (AI) systems can function without a comprehensive data basis – characterized by the terms Volume, Velocity, Variety, Veracity, and Value. The five Vs of Big Data can also be found explained once again in our 2020 blog post “Intelligent Control of Business Processes in Times of Digitalization”.
The quality of the handling of the five Vs determines the quality of all applications based on them. Often, despite digitization, companies still have outdated structures with regard to strategy, project, action, and task control. Progress is documented in various Excel spreadsheets, tasks are sent via e-mail, and Word documents exist in a wide variety of versions on local computers.
The best strategy for benefiting from all this valuable data within a company is to use software in the form of an intelligent database system. This replaces decentralized data description in wikis, Excel lists and the like. When selecting such a suitable system, there are three central aspects to consider in addition to the five Vs: the type of data collection, the consideration of data quality, integrity & security, and the implementation of data processing & visualization. We have already elaborated on this in our blog article on the Intelligent Control of Business Processes in Times of Digitalization but would like to provide the central points again in the following digression.
Excursus: Requirements for the data
DATA COLLECTION
What relevant data is already available internally? Which can be procured externally? What data gaps are becoming apparent – and how can they be closed? How can continuous data acquisition be ensured?
- Central database system
- Accessible everywhere (cloud-based)
- User-friendly interface (intuitive to use)
DATA QUALITY, INTEGRITY & SECURITY
Data Quality (Value): The data stored in your database meets the standards and requirements of the company. The database system applies a set of rules to a specific or complete dataset and stores it in the target database.
- Predefined fields: Field format (number field, text field, user-defined field,….)
- Categories with predefined selection options
- Illustration of the entire organizational structure and cross-sectional topic
Data Integrity (Veracity): Data integrity is concerned with the correctness and completeness of the data in the database. It uses various rules and processes to control how data is entered, stored, and shared, among other things.
- Mandatory fields
- Roles and rights concept
- Review function
- GDPR conformity
Data Security: While data integrity is about keeping data accurate and usable throughout its life cycle, data security aims to protect data against external attacks (as well as internal breaches). Data security includes the totality of all measures that ensure the safety of the data.
- Password policy
- Encryption of the data
- Secure storage and recovery
- Updates and bug-fixing
DATA PROCESSING & VISUALIZATION
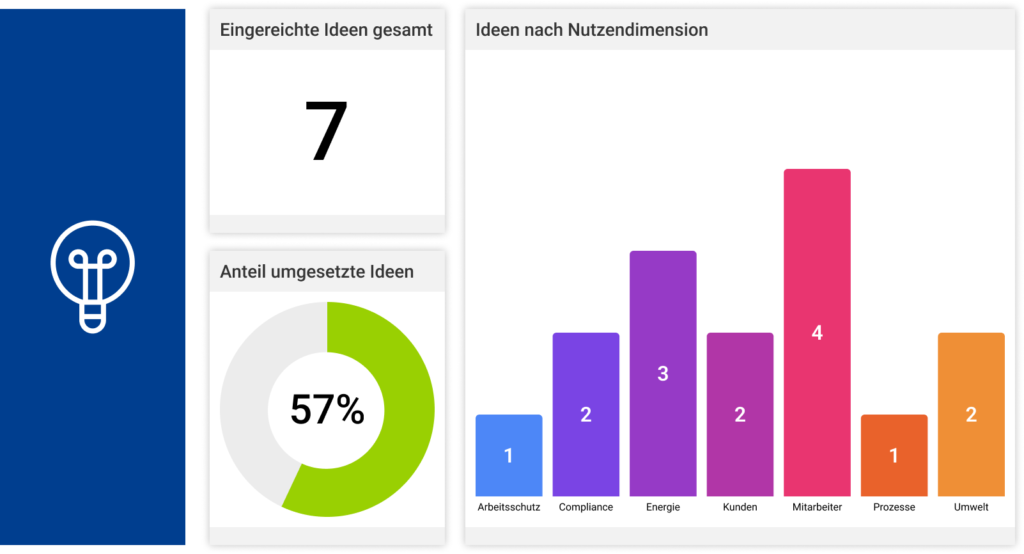
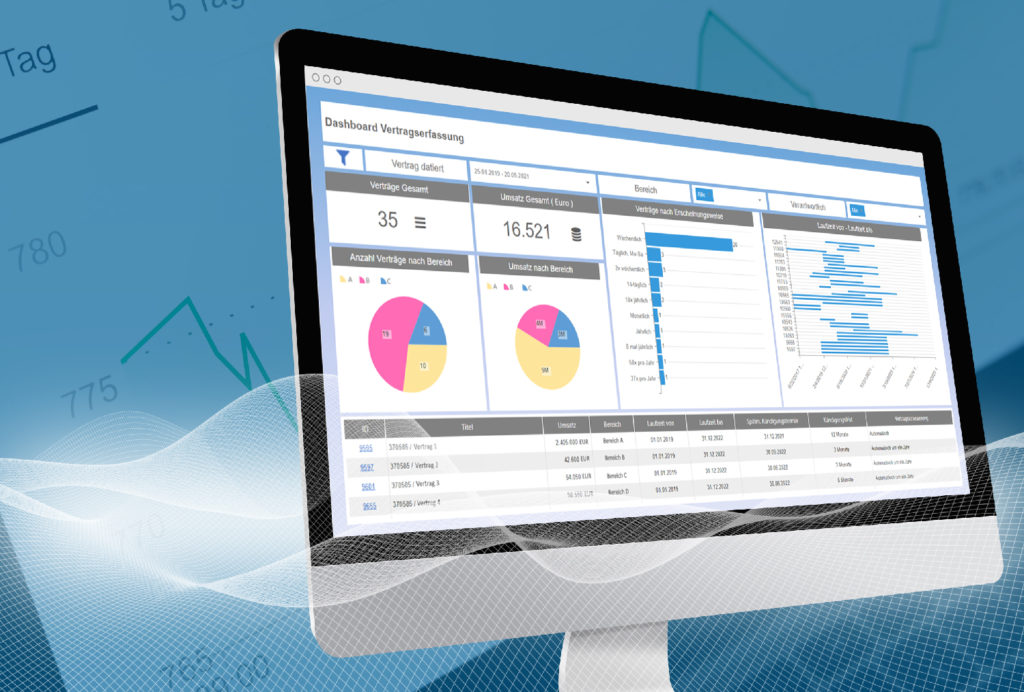
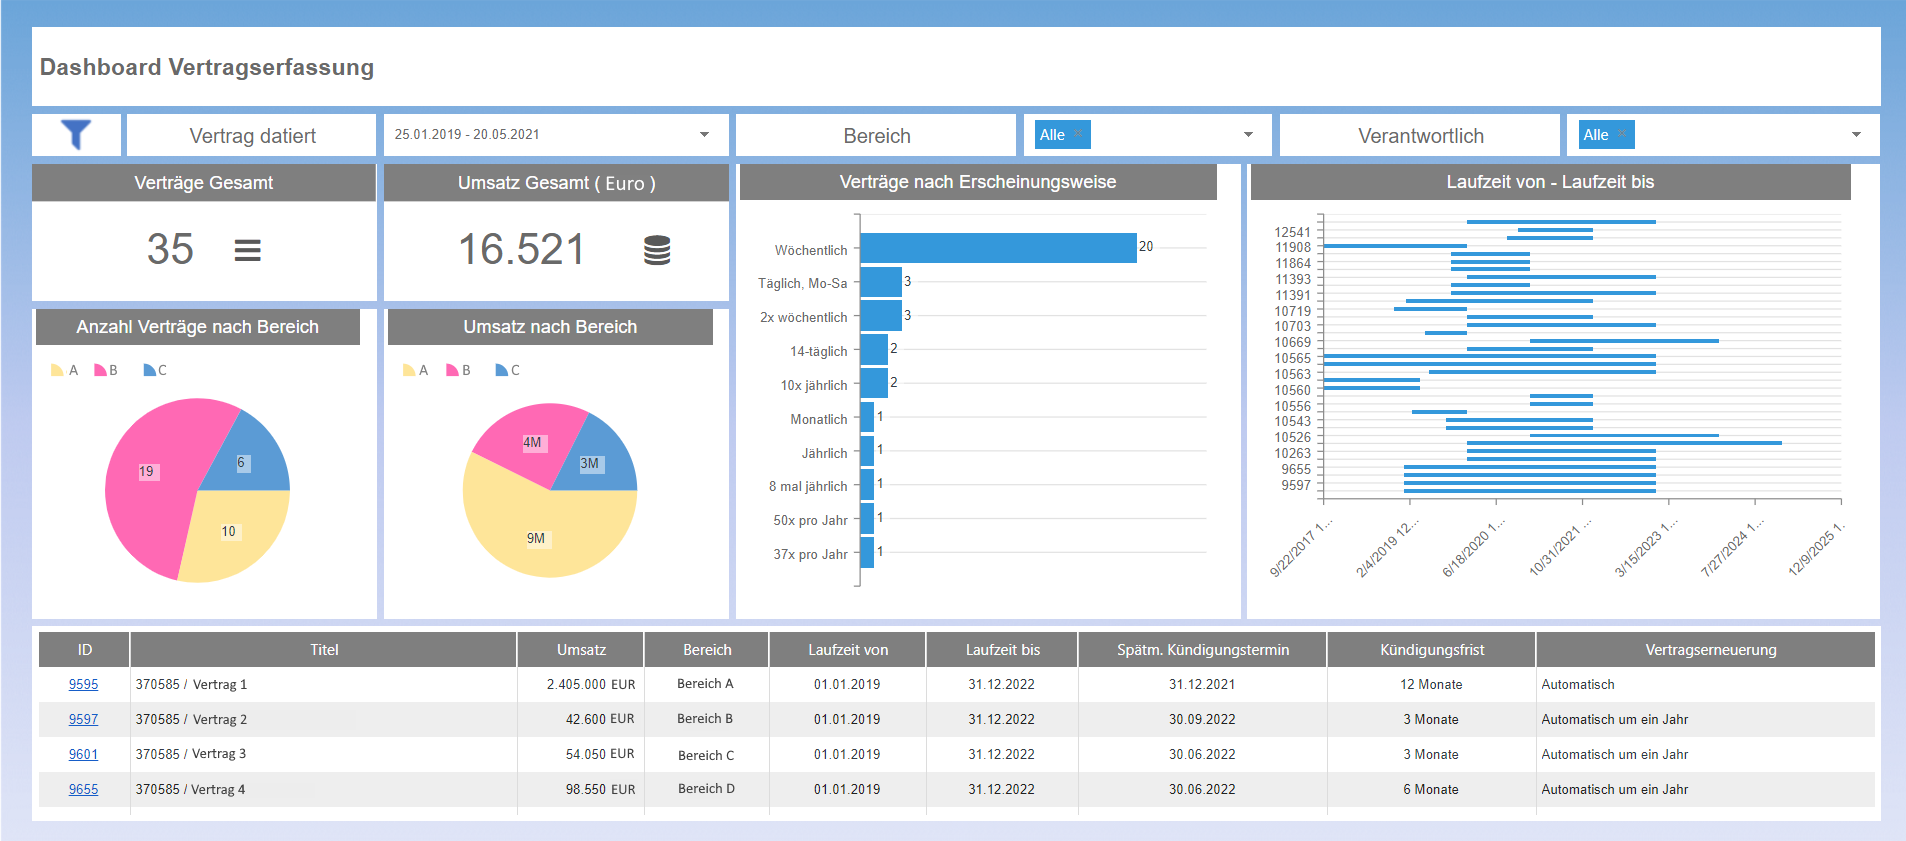
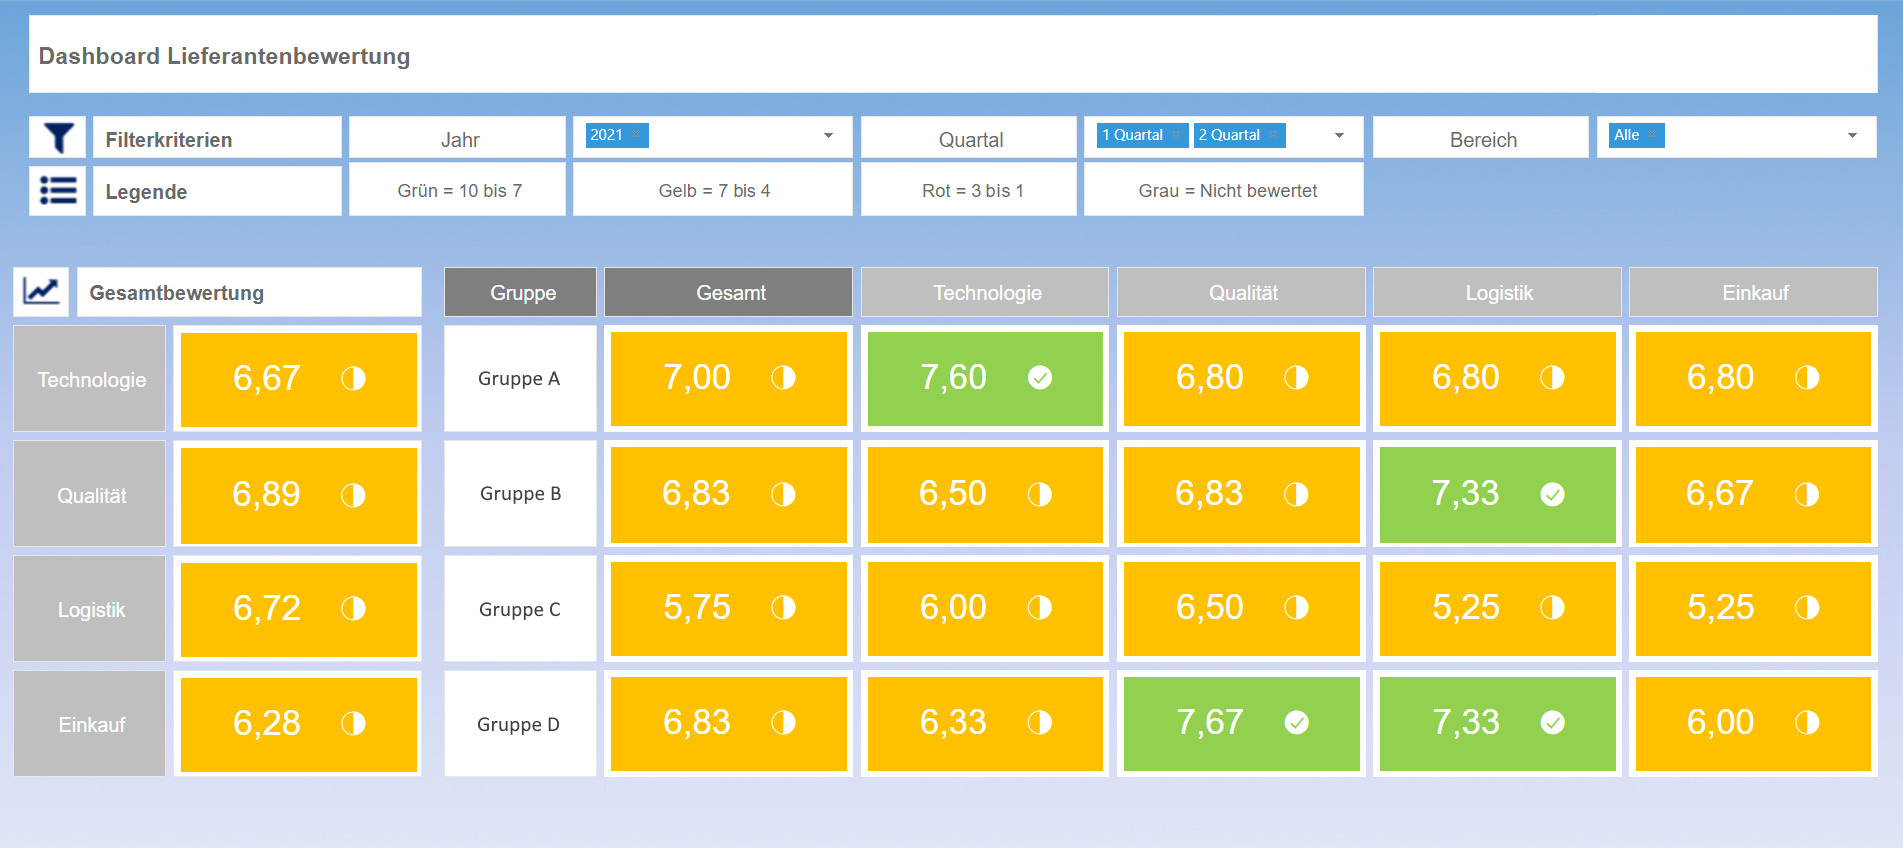
In order to create tangible added value, the available data must be processed and visualized. Ideally, individual tasks or measures as well as entire projects or strategies can be tracked with pinpoint accuracy and intelligent, individually configurable reports can be generated at the push of a button. Employees and management are thus constantly informed about the current status of all tasks and projects to be completed and have a quick overview at all levels thanks to integrated reporting functions: see, understand, act, achieve goals.
- Data cube / OLAP cube
- Dashboard
- Reporting in real time
- Intelligent business management (AI support)
The last point, data processing and visualization, states that intelligent, individually configurable reports can be created at any time at the push of a button. The goal today is no longer to provide only descriptive analysis (retrospective) for decision support, but to enable predictive analysis from which direct recommendations for action or automated reactions (decision automation) can be derived.
So the question is no longer just “What happened (and why)?” but above all “What WILL happen – and what should we do?”. Even those who would otherwise describe themselves as a classic “data grouch” suddenly recognize the value of data at a glance with the help of such graphically prepared evaluations. However, as we hope has become clear from this blog article, such a meaningful end result with a “wow effect” only succeeds after thorough, ongoing preparatory work in terms of a comprehensive data basis and, above all, data maintenance.
For the transformation into a digital company that makes decisions on the basis of suitable data, there must no longer be any difference between documentation and reality in processes/workflows. Because the proverbial “What you don’t know won’t hurt you” can quickly become dangerous for companies, since nothing can be improved that cannot be measured (due to a poor data basis).
Therefore, do not shy away from entering data into a management software. On the contrary, see data entry in a central database as an opportunity to finally get the evaluations you wish for – in real time at the push of a button in any common file format (.pdf, PowerPoint, Word, …) – anytime, anywhere.
The MSO management software is designed for your use without additional programming effort (no-code), simple, fast, secure, and user-friendly – so that you can fully concentrate on your data maintenance to achieve the best possible results.
You want meaningful reports 1:1 according to your PowerPoint slides? Then simply get in touch with us!